XRP Sellers Sentiment Threatens Ripple’s 177% Price Rally

Ripple (XRP) sellers appear to have outpaced the pressure previously put up by bulls, BeInCrypto observed. Over the last 30 days, XRP’s price has increased by 177%, driven by several factors, and has put bears on the back foot.
However, recent data shows that the bullish momentum the altcoin enjoyed has been paused temporarily. If sustained, this could put XRP’s rally on hold for some time.
Ripple Sees Rising Selling Pressure, Low Demand
According to CryptoQuant, XRP’s Taker Buy/Sell Ratio has dropped to 0.93. This ratio helps determine whether bullish sentiment is dominating the derivatives market or if bearish sentiment is in control.
Typically, a ratio below 1 suggests that buyers are in the lead, indicating a more bullish outlook. However, that is not the case as of this writing, as XRP sellers seem to have the upper hand. This current condition could be linked to the profit-taking among traders who had open long positions.
In most cases, when traders cash out their gains, it puts downward pressure on the price. Therefore, it is no surprise that XRP’s price has fallen to $1.42 at press time.
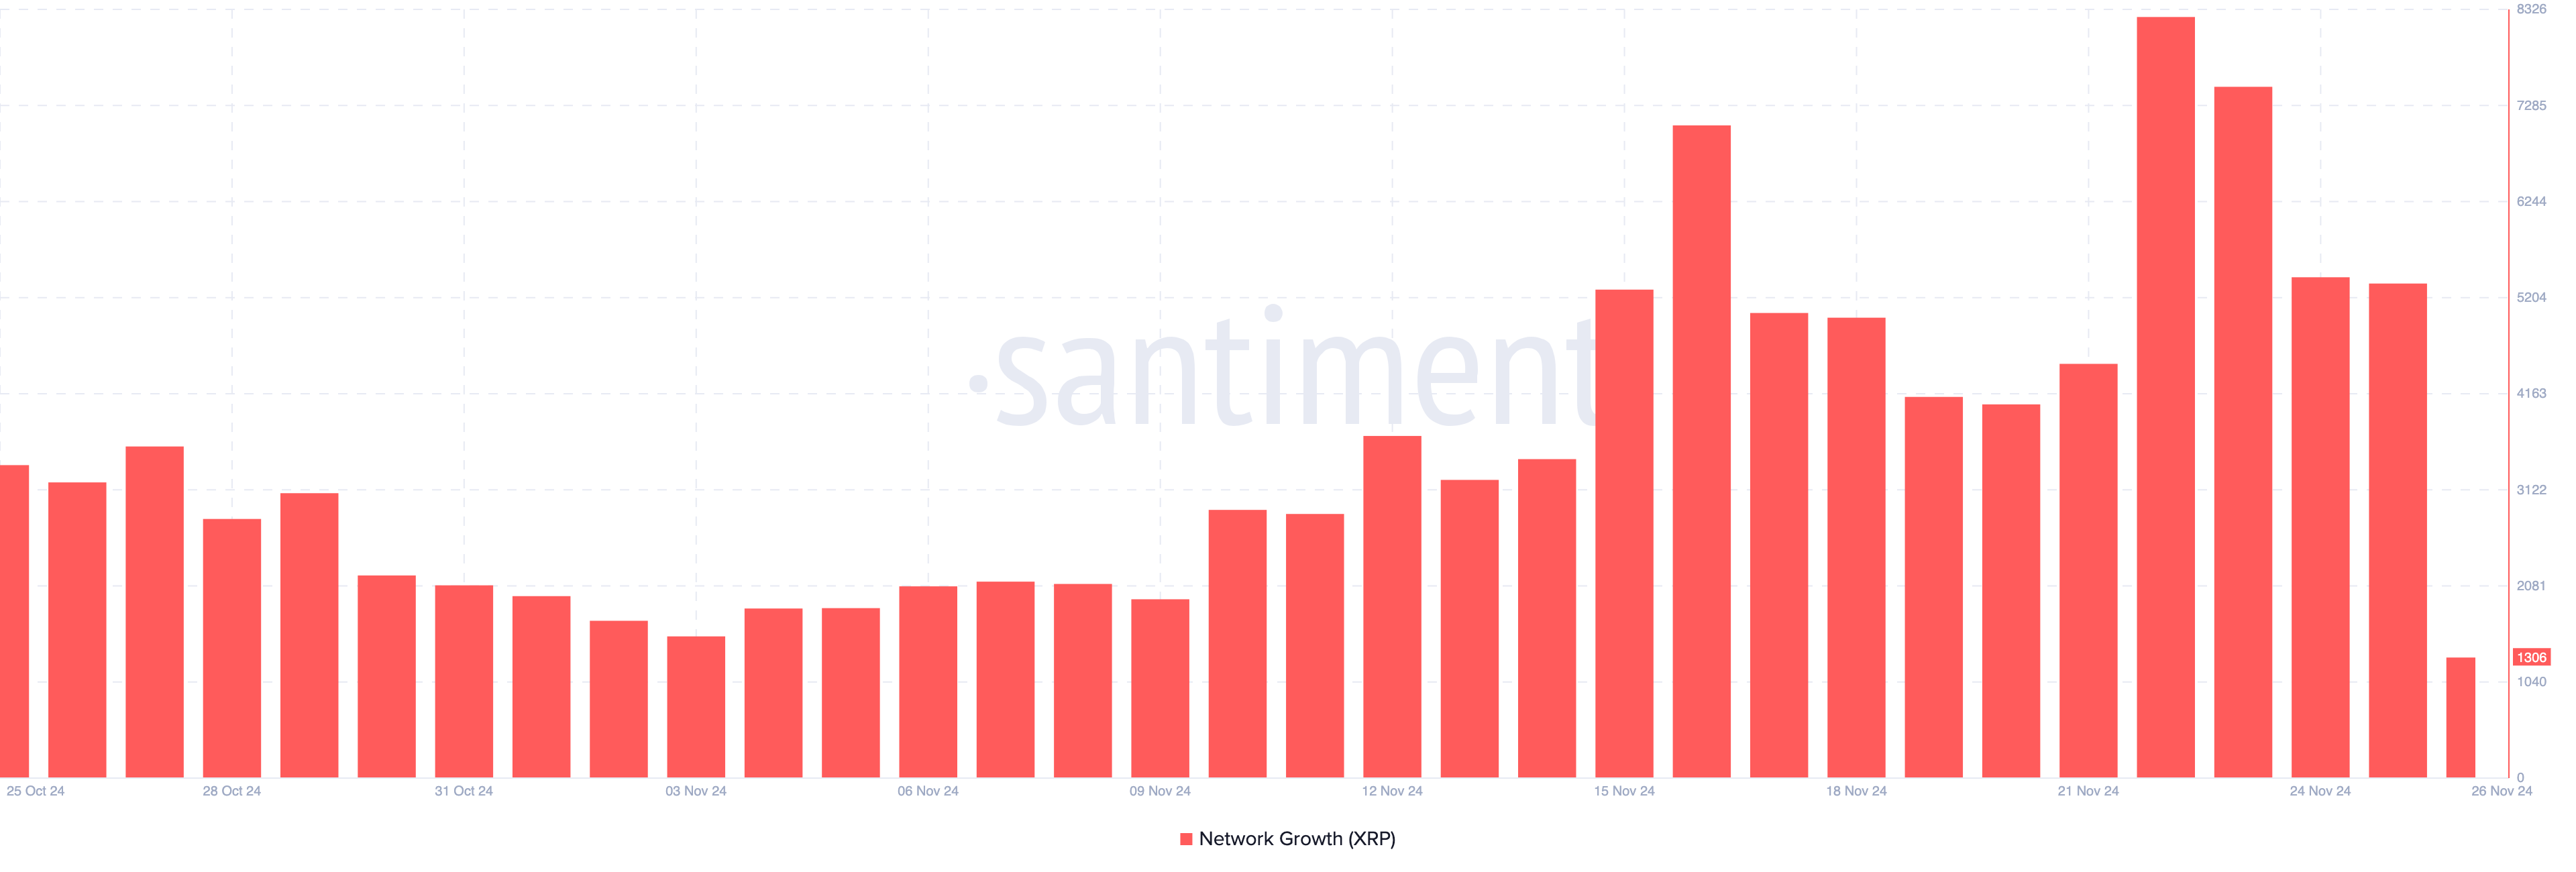
In addition, the Network Growth metric further suggests that XRP sellers are in control. Network Growth tracks the number of new addresses making their first successful transaction on the blockchain, providing insight into the token’s adoption and market traction.
When network growth rises, new market participants buy into the token. However, this is not the case for XRP. According to Santiment, Network Growth on the XRP Ledger has significantly declined. If this trend continues, it could indicate continued selling pressure, potentially leading to further price declines for XRP.

XRP Price Prediction: Time to Go Lower
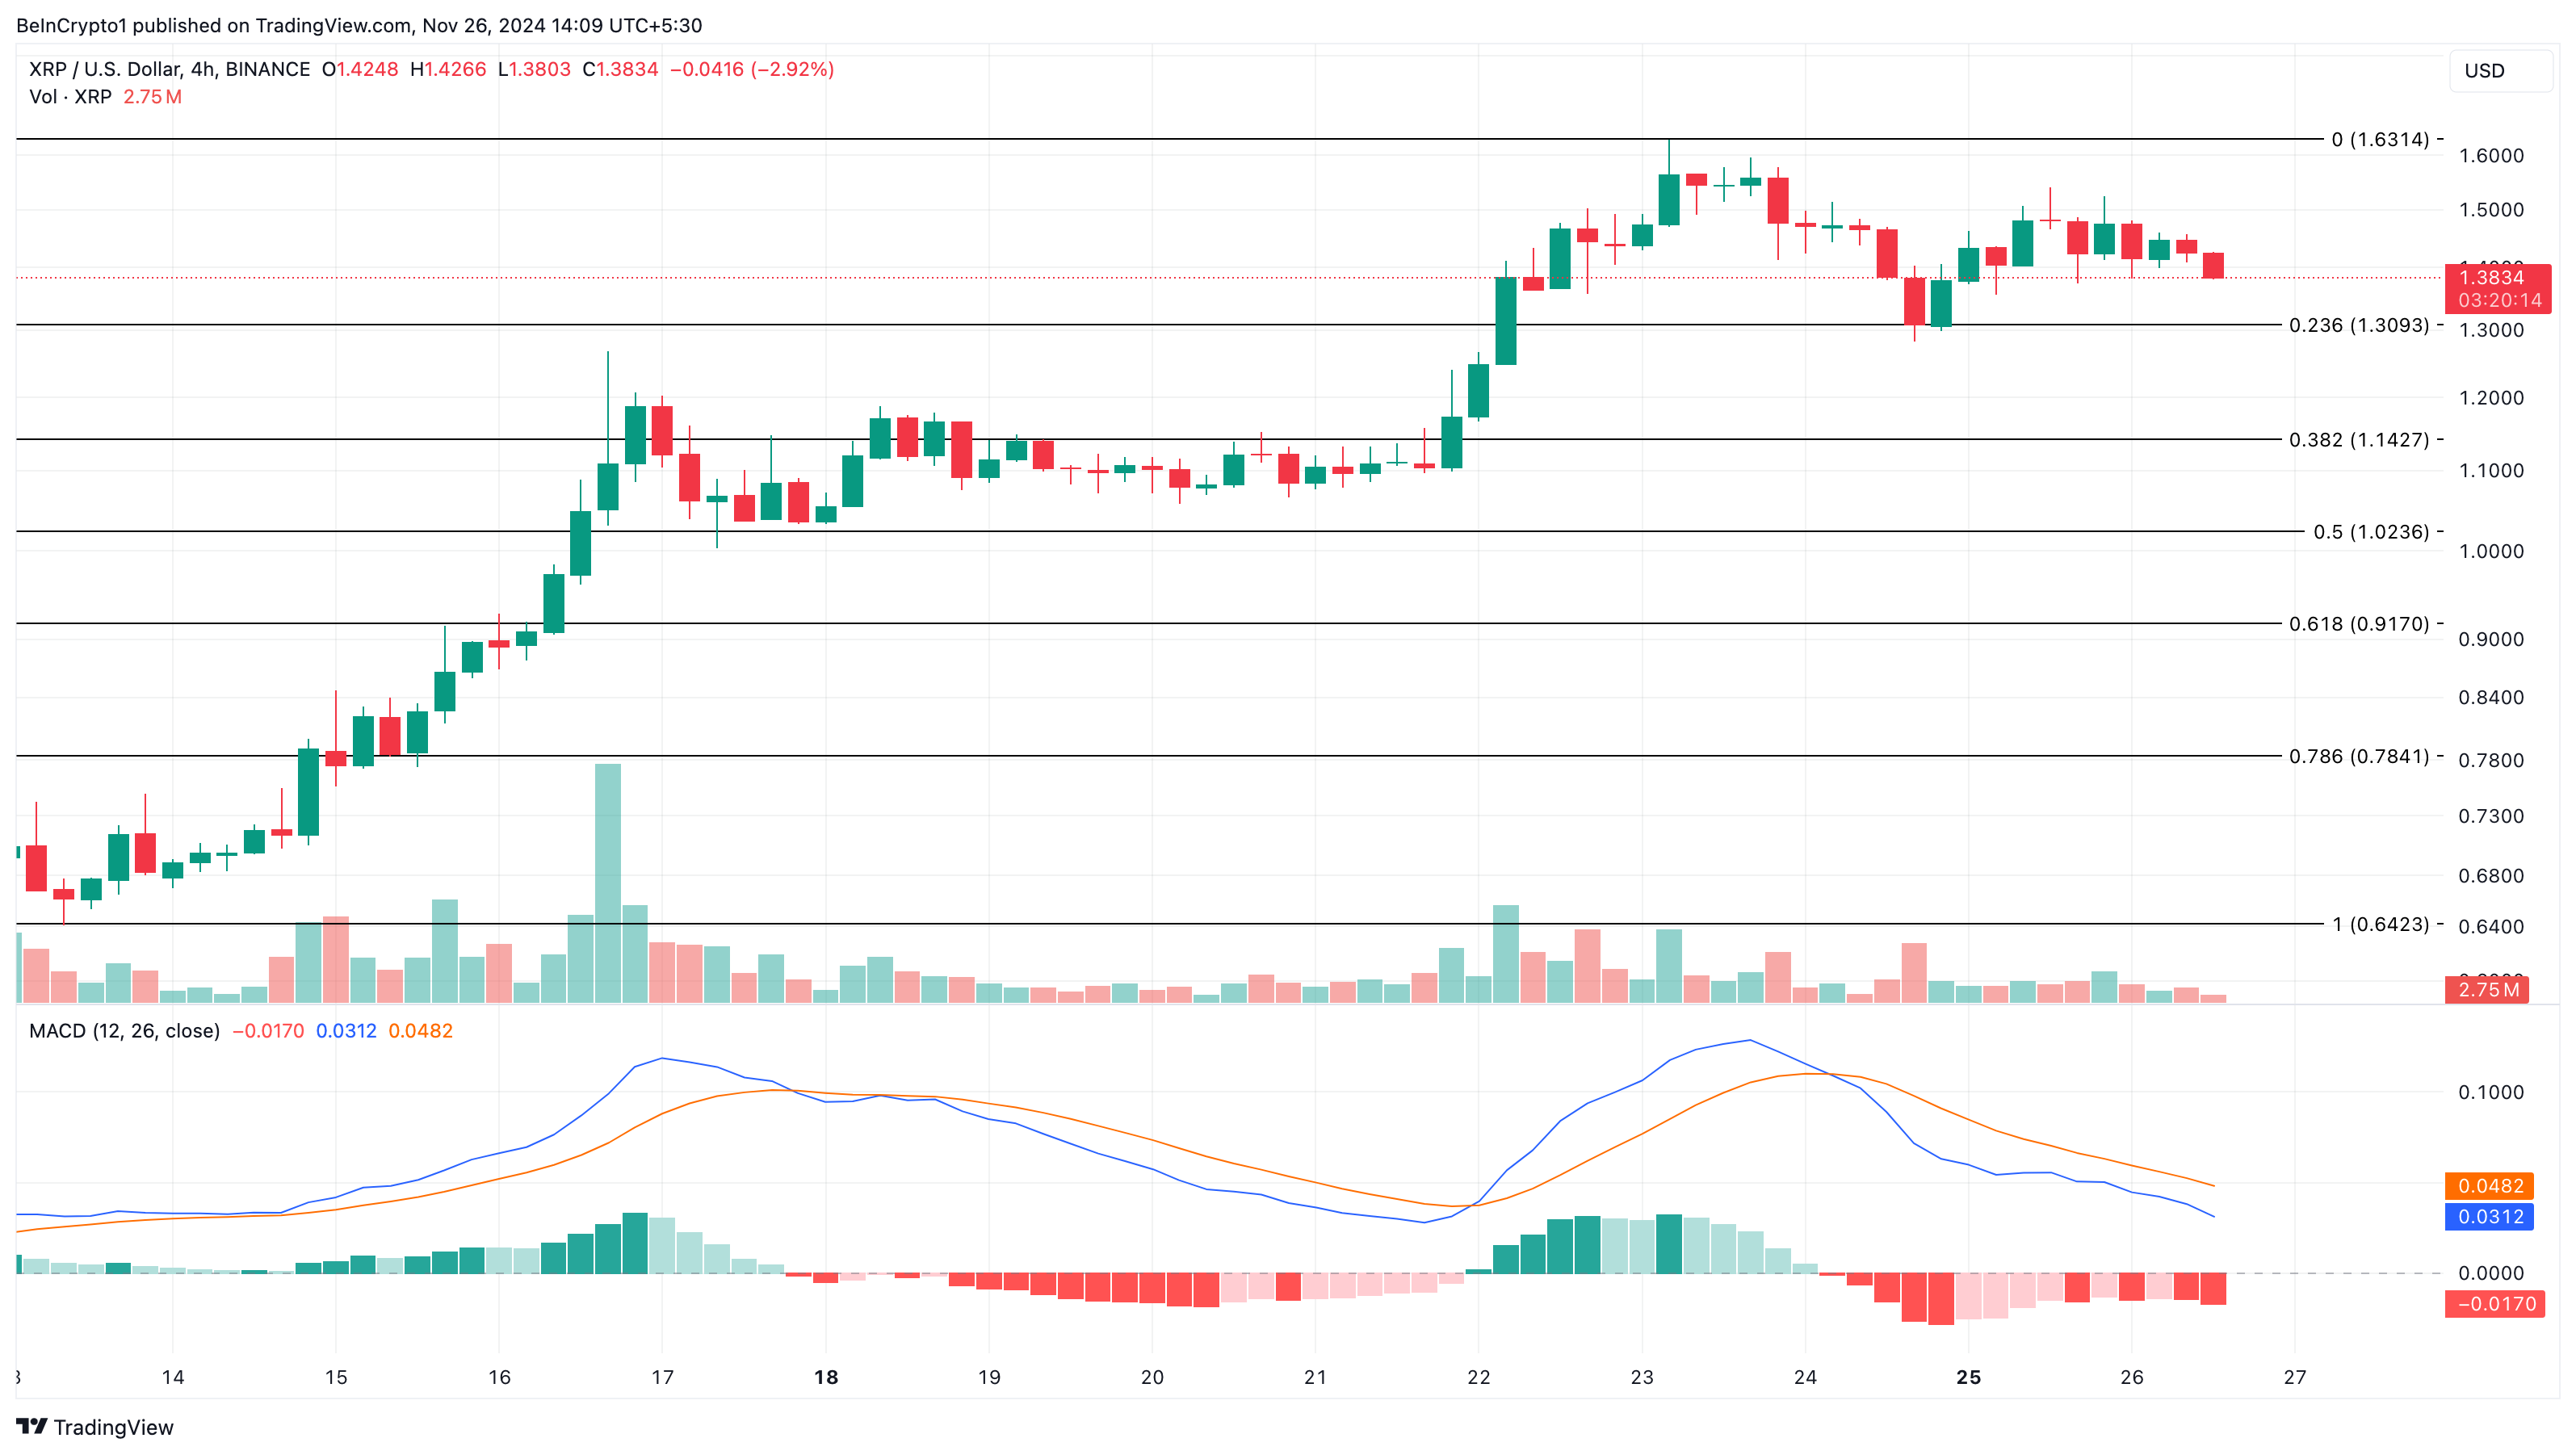
Following the recent development, the Moving Average Convergence Divergence (MACD) on the daily chart has dropped to the negative region. The MACD is a technical oscillator that measures momentum using the difference between the 12 and 26-period Exponential Moving Average (EMA).
When the reading is negative, it means that momentum is bearish. But when it is positive, momentum is bullish. Therefore, the reading on the chart below suggests that XRP sellers are in control.

Should this remain the case, the altcoin’s price could drop to $0.92. On the other hand, if buyers begin to take control, this could change. In that scenario, XRP’s price could rally to $1.63.
Disclaimer
In line with the Trust Project guidelines, this price analysis article is for informational purposes only and should not be considered financial or investment advice. BeInCrypto is committed to accurate, unbiased reporting, but market conditions are subject to change without notice. Always conduct your own research and consult with a professional before making any financial decisions. Please note that our Terms and Conditions, Privacy Policy, and Disclaimers have been updated.


