What Bitcoin Realized Price Predicts About BTC’s Outlook

Bitcoin (BTC) has fallen below its realized price—a crucial metric indicating the average purchase cost of all circulating coins. This dip has weakened hopes for a quick rebound to the $72,000 level, as breaking below the realized price typically indicates mounting selling pressure.
With Bitcoin’s price currently at $68,608, continued trading below this key threshold could suggest a prolonged bearish trend. But how low can BTC go?
Bitcoin’s On-Chain Support Becomes Weak, Whales Sell
On October 20, BTC fell below the realized price, and within three days, the cryptocurrency’s value declined from $69,022 to $66,611. Later, on October 28, the Bitcoin realized price dropped below the spot value. One day after that, BTC rallied to $72,708, sparking speculation that the coin could soon break its all-time high.
However, that wasn’t the case. Data from CryptoQuant reveals Bitcoin’s realized price is $69,352, higher than its current value.
Typically, when the realized price sits below the market price, it acts as on-chain support, implying potential upward movement. But with it now above, BTC’s chances of reclaiming the $72,000 level in the short term appear limited.
Read more: 7 Best Crypto Exchanges in the USA for Bitcoin (BTC) Trading
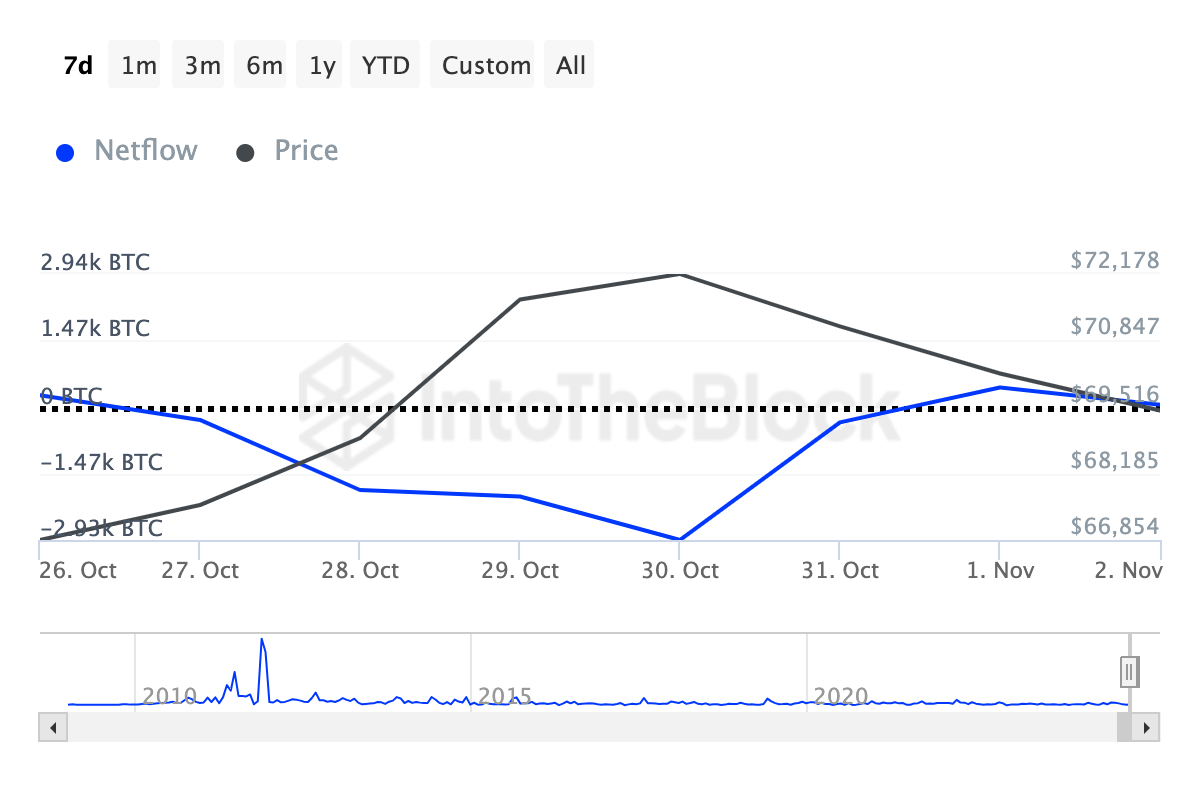
Another indicator suggesting that Bitcoin might find it hard to rebound is the large holders’ netflow. This metric looks at the activity of addresses holding between 01.% and 1% of the total circulating supply.
When the large holders’ netflow is positive, crypto whales are accumulating, and prices can increase. However, based on IntoTheBlock’s data, the netflow has decreased, meaning whales have sold more coins than they purchased within the last seven days.
If sustained, this current condition will align with Bitcoin’s realized price position of another potential decline.

BTC Price Prediction: Retracement to $66,000 Looms
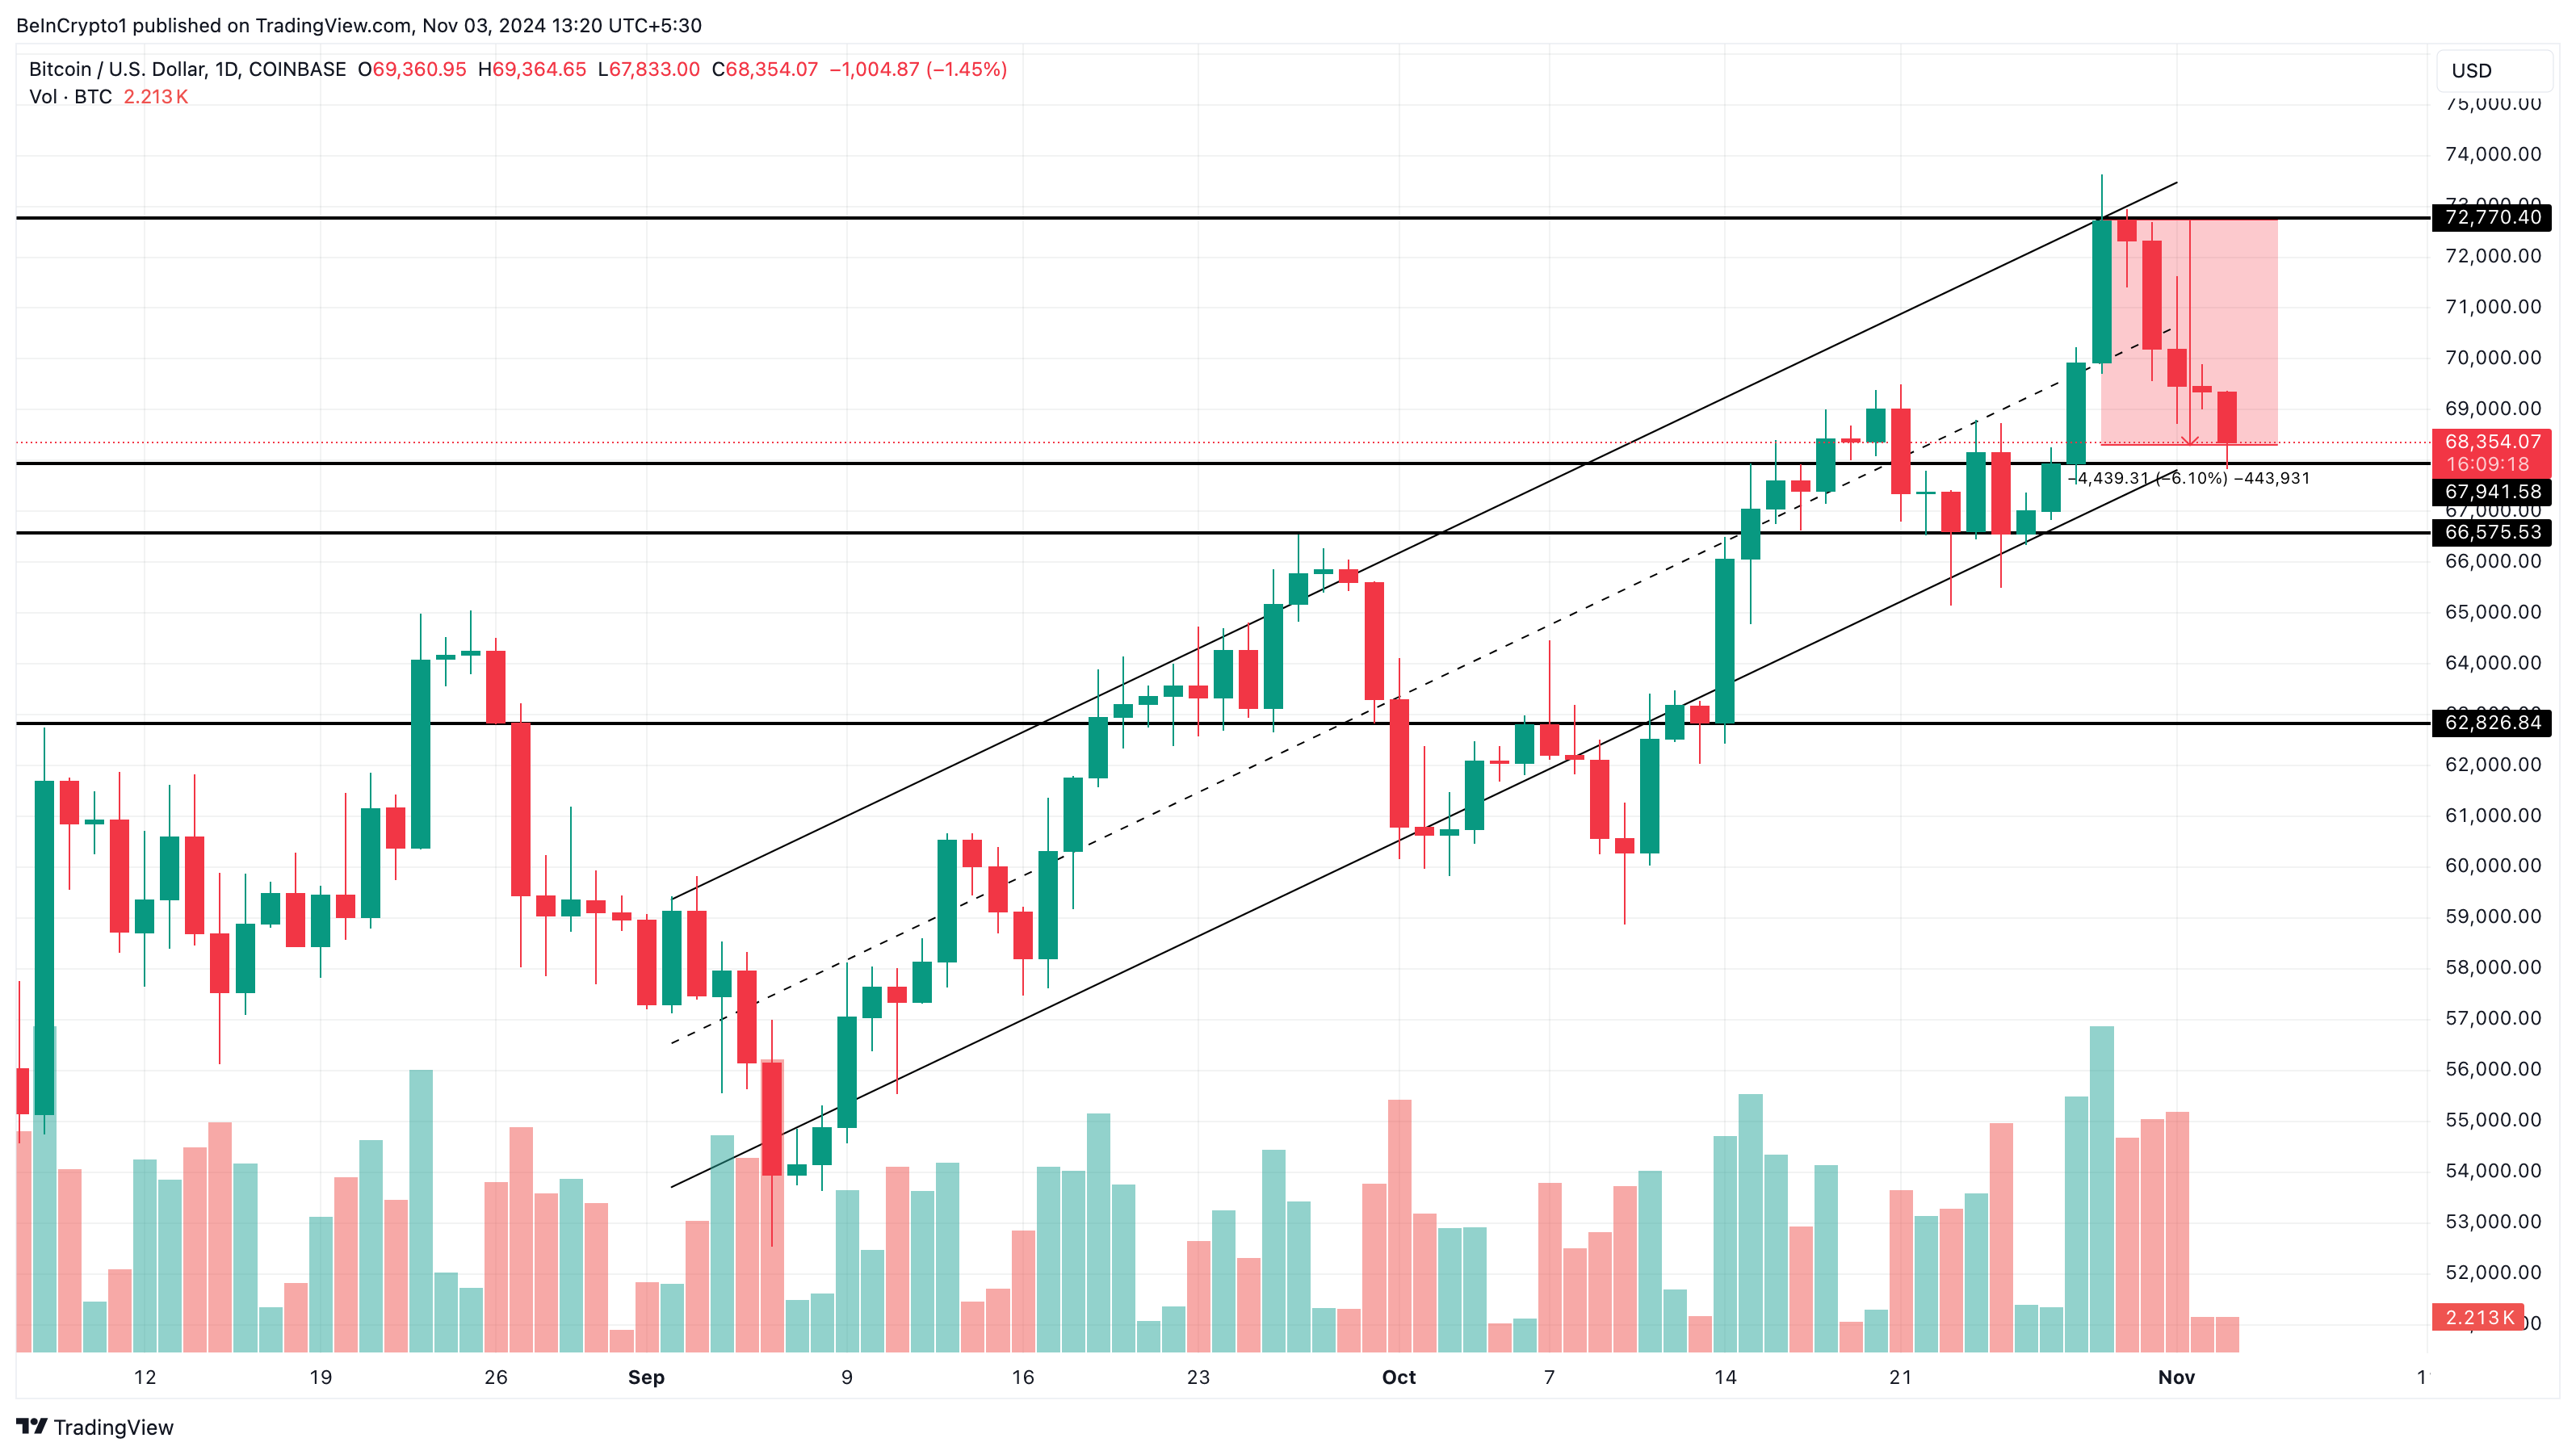
Bitcoin’s current price marks a 6% drop from its recent local top, placing it on the edge of breaking below an ascending channel on the daily chart.
This pattern, formed by two upward trendlines, shows resistance at the top and support at the bottom. Currently, Bitcoin is hovering near the support line at $67,941.
If BTC falls below this support, it could slide to $66,575, with a further decline to $62,826 in a more bearish outlook.
Read more: Bitcoin (BTC) Price Prediction 2024/2025/2030

Conversely, if Bitcoin’s realized price drops below its current value, it could signal a trend reversal. In that case, BTC may rally toward $72,770, potentially setting the stage for a new all-time high.
Disclaimer
In line with the Trust Project guidelines, this price analysis article is for informational purposes only and should not be considered financial or investment advice. BeInCrypto is committed to accurate, unbiased reporting, but market conditions are subject to change without notice. Always conduct your own research and consult with a professional before making any financial decisions. Please note that our Terms and Conditions, Privacy Policy, and Disclaimers have been updated.


