Bitcoin’s Spent Output Profit Ratio shows volatility amid post-halving corrections

Onchain Highlights
DEFINITION: The Spent Output Profit Ratio (SOPR) is computed by dividing the realized value (in USD) divided by the value at creation (USD) of a spent output. Or simply: price sold / price paid.
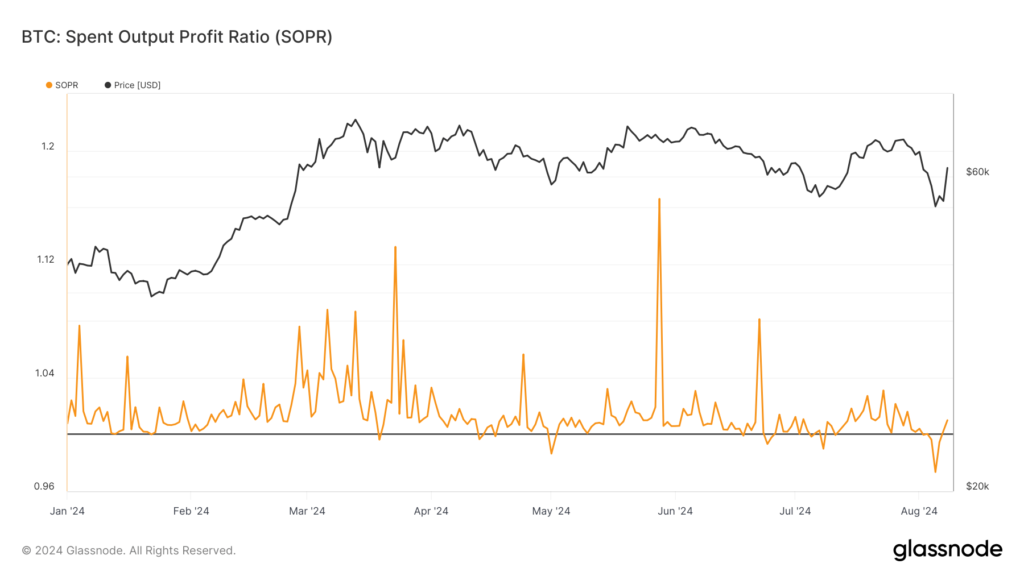
Bitcoin’s Spent Output Profit Ratio (SOPR) has displayed marked fluctuations throughout 2024. The SOPR has consistently hovered near or above 1.0, indicating that the majority of spent outputs were sold at a profit.
However, in recent months, the ratio has witnessed periods of sharp declines, particularly in July and early August, briefly dipping below 1.0. This shift suggests that holders were realizing losses during these periods, potentially due to broader market corrections.
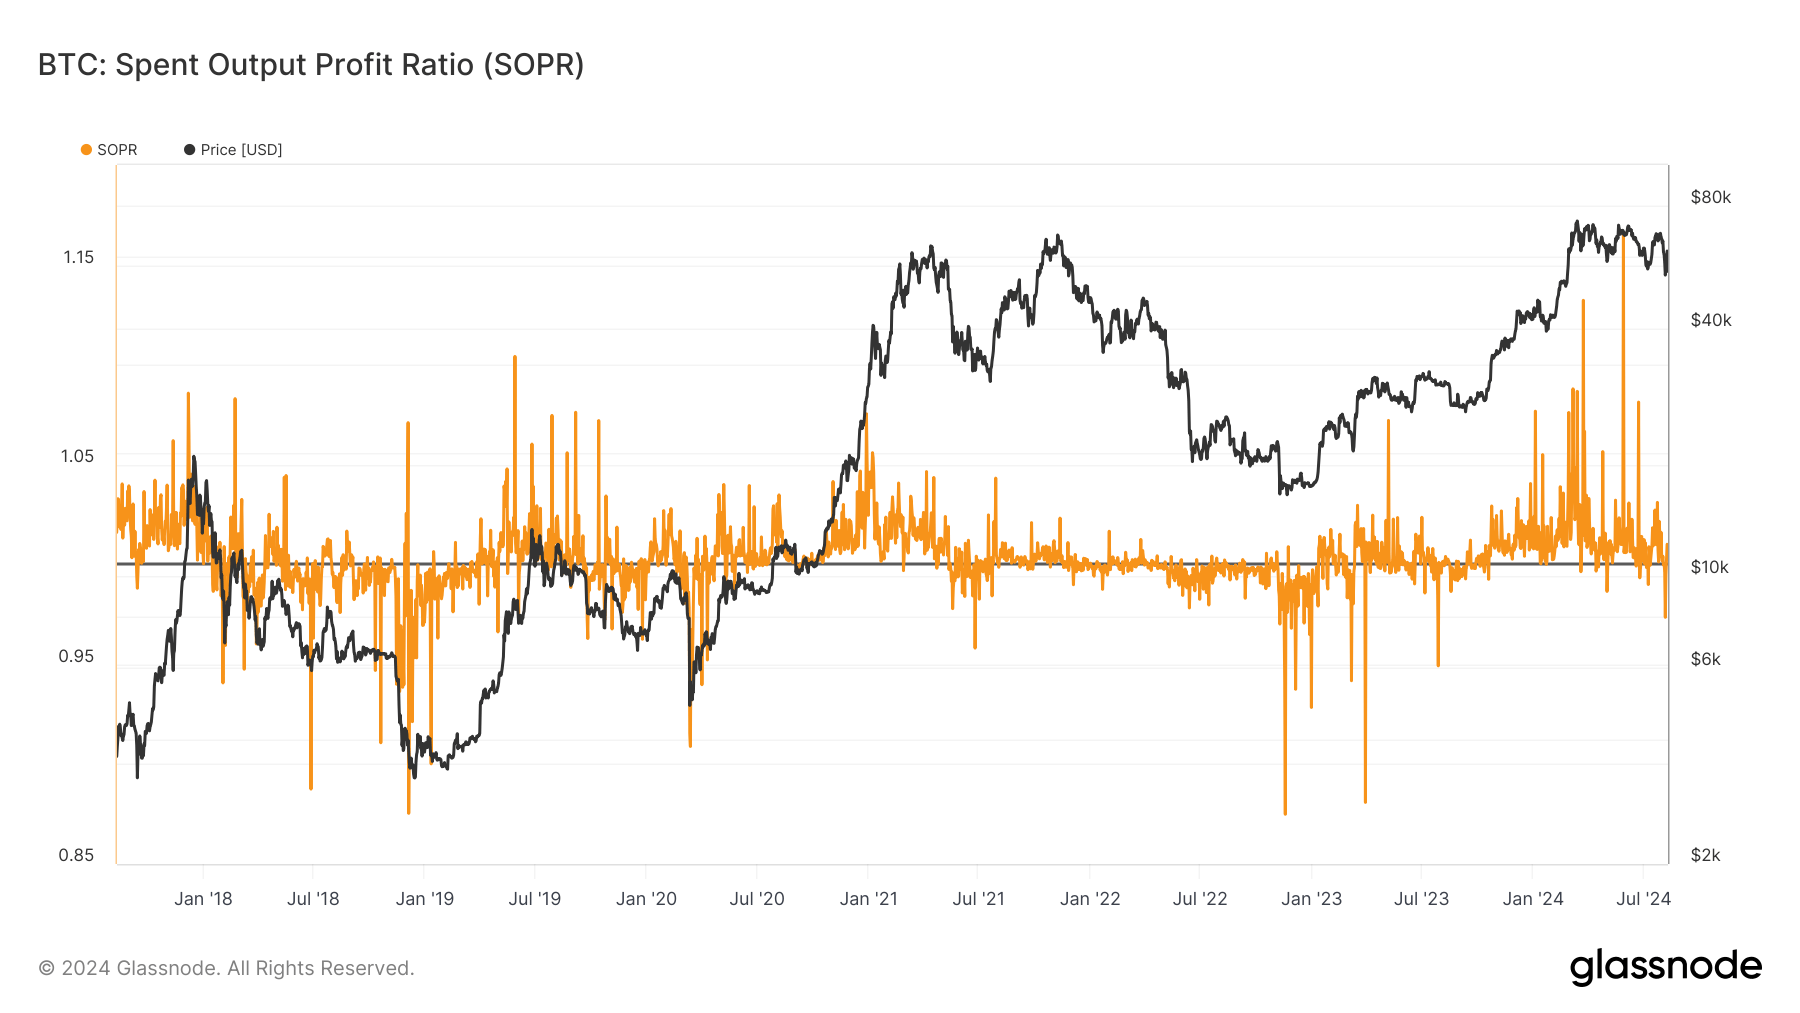
Looking at the longer-term trend since 2018, the SOPR has been closely tied to Bitcoin’s price movements, often spiking during significant price rallies. The recent behavior of the SOPR indicates a market grappling with post-halving volatility.
As Bitcoin continues to trade near the $60,000 mark, the SOPR’s movements will be crucial to watch for signs of whether the market is transitioning back to profitability or if further losses could be anticipated.


